A higher Octave for PALM

PALM — Pemutation Analysis of Linear Models — uses either MATLAB or Octave behind the scenes. It can be executed from within either of these environments, or from the shell, in which case either of these is invoked, depending on how PALM was configured.

For users who do not want or cannot spend thousands of dollars in MATLAB licenses, Octave comes for free, and offers quite much the same benefits. However, for Octave, some functionalities in PALM require version 4.4.1 or higher. However, stable Linux distributions such as Red Hat Enterprise Linux and related (such as CentOS and Scientific Linux) still offer only 3.8.2 in the official repositories at the time of this writing, leaving the user with the task of finding an unofficial package or compiling from the source. The latter task, however, can be daunting: Octave is notoriously difficult to compile, with a myriad of dependencies.

A much simpler approach is to use Flatpak or Snappy. These are systems for distribution of Linux applications. Snappy is sponsored by Canonical (that maintains Ubuntu), whereas Flatpak appears to be the preferred tool for Fedora and openSUSE. Using either system is quite simple, and here the focus is on Flatpak.

To have a working installation of Octave, all that needs be done is:

1) Make sure Flatpak is installed:

On a RHEL/CentOS system, use (as root):

yum install flatpak

For openSUSE, use (as root):

zypper install flatpak

For Ubuntu and other Debian-based systems:

sudo apt install flatpak

2) Add the Flathub repository:

flatpak remote-add --if-not-exists flathub https://flathub.org/repo/flathub.flatpakrepo

3) Install Octave:

flatpak install flathub org.octave.Octave

4) Run it!

flatpak run org.octave.Octave

Only the installation of Flatpak needs be done as root. Once it has been installed, repositories and applications (such as Octave, among many others) can be installed at the user level. These can also be installed and made available system-wide (if run as root).

Configuring PALM

From version alpha117 onwards, the executable file ‘palm’ (not to be confused with ‘palm.m’) will include a variable named “OCTAVEBIN”, which specifies how Octave should be called. Change it from the default:

OCTAVEBIN=/usr/bin/octave

so that it invokes the version installed with Flatpak:

OCTAVEBIN="/usr/bin/flatpak run org.octave.Octave"

After making the above edits, it should be possible to run PALM directly from the system shell using the version installed via Flatpak. Alternatively, it should also be possible to invoke Octave (as in step 4 above), then use the command “addpath” to specify the location of palm.m, and then call PALM from the Octave prompt.

Octave packages

Handling of packages when Octave is installed via Flatpak is the same as usual, that is, via the command ‘pkg’ run from within Octave. More details here.

Better statistics, faster

Faster permutation inference

Permutation tests are more robust and help to make scientific results more reproducible by depending on fewer assumptions. However, they are computationally intensive as recomputing a model thousands of times can be slow. The purpose of this post is to briefly list some options available for speeding up permutation.

Firstly, no speed-ups may be needed: for small sample sizes, or low resolutions, or small regions of interest, a permutation test can run in a matter of minutes. For larger data, however, accelerations may be of use. One option is acceleration through parallel processing or GPUs (for example applications of the latter, see Eklund et al., 2012, Eklund et al., 2013 and Hernández et al., 2013; references below), though this does require specialised implementation. Another option is to reduce the computational burden by exploiting the properties of the statistics and their distributions. A menu of options includes:

  • Do few permutations (shorthand name: fewperms). The results remain valid on average, although the p-values will have higher variability.
  • Keep permuting until a fixed number of permutations with statistic larger than the unpermuted is found (a.k.a., negative binomial; shorthand name: negbin).
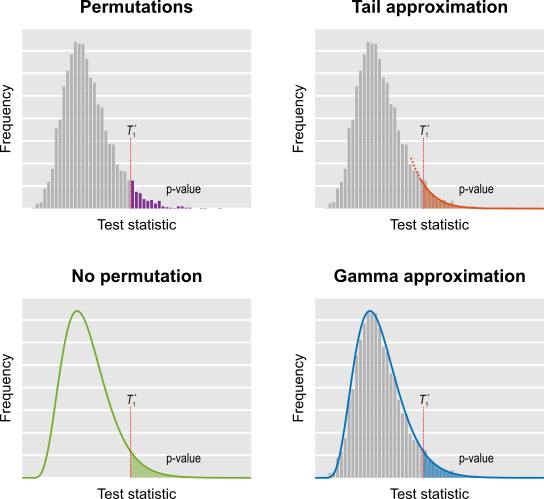
  • Do a few permutations, then approximate the tail of the permutation distribution by fitting a generalised Pareto distribution to its tail (shorthand name: tail).
  • Approximate the permutation distribution with a gamma distribution, using simple properties of the test statistic itself, amazingly not requiring any permutations at all (shorthand name: noperm).
  • Do a few permutations, then approximate the full permutation distribution by fitting a gamma distribution (shorthand name: gamma).
  • Run permutations on only a few voxels, then fill the missing ones using low-rank matrix completion theory (shorthand name: lowrank).

These strategies allow accelerations >100x, yielding nearly identical results as in the non-accelerated case. Some, such as tail approximation, are generic enough to be used nearly all the most common scenarios, including univariate and multivariate tests, spatial statistics, and for correction for multiple testing.

In addition to accelerating permutation tests, some of these strategies, such as tail and noperm, allow continuous p-values to be found, and refine the p-values far into the tail of the distribution, thus avoiding the usual discreteness of p-values, which can be a problem in some applications if too few permutations are done.

These methods are available in the tool PALM — Permutation Analysis of Linear Models — and the complete description, evaluation, and application to the re-analysis of a voxel-based morphometry study (Douaud et al., 2007) have been just published in Winkler et al., 2016 (for the Supplementary Material, click here). The paper includes a flow chart prescribing these various approaches for each case, reproduced below.

Faster permutation inference

The hope is that these accelerations will facilitate the use of permutation tests and, if used in combination with hardware and/or software improvements, can further expedite computation leaving little reason not to use these tests.

References

Contributed to this post: Tom Nichols, Ged Ridgway.

Three HCP utilities

If you are working with data from the Human Connectome Project (HCP), perhaps these three small Octave/MATLAB utilities may be of some use:

  • hcp2blocks.m: Takes the restricted file with information about kinship and zygosity and produces a multi-level exchangeability blocks file that can be used with PALM for permutation inference. It is fully described here.
  • hcp2solar.m: Takes restricted and unrestricted files to produce a pedigree file that can be used with SOLAR for heritability and genome-wide association analyses.
  • picktraits.m: Takes either restricted or unrestricted files, a list of traits and a list of subject IDs to produce tables with selected traits for the selected subjects. These can be used to, e.g., produce design matrices for subsequent analysis.

These functions need to parse relatively large CSV files, which is somewhat inefficient in MATLAB and Octave. Still, since these commands usually have to be executed only once for a particular analysis, a 1-2 minute wait seems acceptable.

If downloaded directly from the above links, remember also to download the prerequisites: strcsvread.m and strcsvwrite.m. Alternatively, clone the full repository from GitHub. The link is this. Other tools may be added in the future.

A fourth utility

For the HCP-S1200 release (March/2017), zygosity information is provided in the fields ZygositySR (self-reported zygosity) and ZygosityGT (zygosity determined by genetic methods for select subjects). If needed, these two fields can be merged into a new field named simply Zygosity. To do so, use a fourth utility, command mergezyg.

Downsampling (decimating) a brain surface

Downsampled average cortical surfaces at different iterations (n), with the respective number of vertices (V), edges (E) and faces (F).

In the previous post, a method to display brain surfaces interactively in PDF documents was presented. While the method is already much more efficient than it was when it first appeared some years ago, the display of highly resolved meshes can be computationally intensive, and may make even the most enthusiastic readers give up even opening the file.

If the data being shown has low spatial frequency, an alternative way to display, which preserves generally the amount of information, is to decimate the mesh, downsampling it to a lower resolution. Although in theory this can be done in the native (subject-level) geometry through retessellation (i.e., interpolation of coordinates), the interest in downsampling usually is at the group level, in which case the subjects have all been interpolated to a common grid, which in general is a geodesic sphere produced by subdividing recursively an icosahedron (see this earlier post). If, at each iteration, the vertices and faces are added in a certain order (such as in FreeSurfer‘s fsaverage or in the one generated with the platonic command), downsampling is relatively straightforward, whatever is the type of data.

Vertexwise data

For vertexwise data, downsampling can be based on the fact that vertices are added (appended) in a certain order as the icosahedron is constructed:

  • Vertices 1-12 correspond to n = 0, i.e., no subdivision, or ico0.
  • Vertices 13-42 correspond to the vertices that, once added to the ico0, make it ico1 (first iteration of subdivision, n = 1).
  • Vertices 43-162 correspond to the vertices that, once added to ico1, make it ico2 (second iteration, n = 2).
  • Vertices 163-642, likewise, make ico3.
  • Vertices 643-2562 make ico4.
  • Vertices 2563-10242 make ico5.
  • Vertices 10243-40962 make ico6, etc.

Thus, if the data is vertexwise (also known as curvature, such as cortical thickness or curvature indices proper), the above information is sufficient to downsample the data: to reduce down to an ico3, for instance, all what one needs to do is to pick the vertices 1 through 642, ignoring 643 onwards.

Facewise data

Data stored at each face (triangle) generally correspond to areal quantities, that require mass conservation. For both fsaverage and platonic icosahedrons, the faces are added in a particular order such that, at each iteration of the subdivision, a given face index is replaced in situ for four other faces: one can simply collapse (via sum or average) the data of every four faces into a new one.

Surface geometry

If the objective is to decimate the surface geometry, i.e., the mesh itself, as opposed to quantities assigned to vertices or faces, one can use similar steps:

  1. Select the vertices from the first up to the last vertex of the icosahedron in the level needed.
  2. Iteratively downsample the face indices by selecting first those that are formed by three vertices that were appended for the current iteration, then for those that have two vertices appended in the current iteration, then connecting the remaining three vertices to form a new, larger face.

Applications

Using downsampled data is useful not only to display meshes in PDF documents, but also, some analyses may not require a high resolution as the default mesh (ico7), particularly for processes that vary smoothly across the cortex, such as cortical thickness. Using a lower resolution mesh can be just as informative, while operating at a fraction of the computational cost.

A script

A script that does the tasks above using Matlab/Octave is here: icodown.m. It is also available as part of the areal package described here, which also satisfies all its dependencies. Input and output formats are described here.

Non-Parametric Combination (NPC) for brain imaging

Have you ever had an analysis in which there was a large set of contrasts, all of interest, and you were worried about multiple testing? An eventual effect would be missed by a simple Bonferroni correction, but you did not know what else to do? Or did you have a set of different studies and you wished to obtain a style of meta-analytic result, indicating whether there would be evidence across all of them, without requiring the studies to be all consistently significant?

The Non-Parametric Combination (NPC) solves these issues. It is a way of performing joint inference on multiple data collected on the same experimental units (e.g., same subjects), all with minimal assumptions. The method was proposed originally by Pesarin (1990, 1992) [see references below], independently by Blair and Karninski (1993), and described extensively by Pesarin and Salmaso (2010). In this blog entry, the NPC is presented in brief, with emphasis on the modifications we introduce to render it feasible for brain imaging. The complete details are in our paper that has just been published in the journal Human Brain Mapping.

NPC in a nutshell

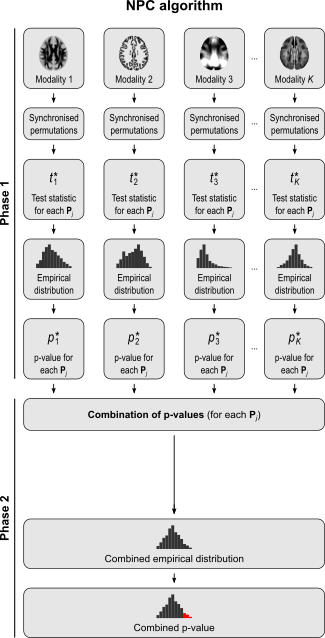
The NPC consists of, in a first phase, testing each hypothesis separately using permutations that are performed synchronously across datasets; these tests are termed partial tests. The resulting statistics for each and every permutation are recorded, allowing an estimate of the complete empirical null distribution to be constructed for each one. In a second phase, the empirical p-values for each statistic are combined, for each permutation, into a joint statistic. As such a combined joint statistic is produced from the previous permutations, an estimate of its empirical distribution function is immediately known, and so is the p-value of the joint test. A flowchart of the original algorithm is shown below; click to see it side-by-side with the modified one (described below).
A host of combining functions

The null hypothesis of the NPC is that null hypotheses for all partial tests are true, and the alternative hypothesis that any is false, which is the same null of a union-intersection test (UIT; Roy, 1953). The rejection region depends on how the combined statistic is produced. Various combining functions, which produce such combined statistics, can be considered, and some of the most well known are listed in the table below:

Method Statistic p-value
Tippett \min \left(p_{k}\right) 1-\left(1-T\right)^{K}
Fisher -2 \sum_{k=1}^{K} \ln\left(p_{k}\right) 1-\chi^{2}\left(T;\;\nu=2K\right)
Stouffer \frac{1}{\sqrt{K}} \sum_{k=1}^{K} \Phi^{-1}\left(1-p_{k}\right) 1-\Phi\left(T;\;\mu=0,\;\sigma^2=1\right)
Mudholkar–George \frac{1}{\pi}\sqrt{\frac{3(5K+4)}{K(5K+2)}}\sum_{k=1}^{K} \ln\left(\frac{1-p_{k}}{p_{k}}\right) 1-t_{\text{cdf}}(T;\;\nu=5K+4)

In the table, K is the number of partial tests, and the remaining of the variables follow the usual notation (see the Table 1 in the paper for the complete description). Many of these combining functions were proposed over the years for applications such as meta-analyses, and many of them assume independence between the tests being combined, and will give incorrect p-values if such assumption is not met. In the NPC, lack of dependence is not a problem, even if these same functions are used: the synchronised permutations ensure that any dependence, if existing, is taken into account, and this is done so implicitly, with no need for explicit modelling.

The different combining functions lead to different rejection regions for the null hypothesis. For the four combining functions in the table above, the respective rejection regions are in the figure below.

The combining functions can be modified to allow combination of tests so as to favour hypotheses with concordant directions, or be modified for bi-directional tests. Click on the figure above for examples of these cases (again, see the paper for the complete details).

Two problems, one solution

The multiple testing problem is well known in brain imaging: as an image comprises thousands of voxels/vertices/faces, correction is necessary. Bonferroni is in general too conservative, and various other approaches have been proposed, such as the random field theory. Permutation tests provide control over the familywise error rate (FWER) for the multiple tests across space, requiring only the assumption of exchangeability. This is all well known; see Nichols and Hayasaka (2003) and Winkler et al. (2014) for details.

However, another type of multiple testing is also common: analyses that test multiple hypotheses using the same model, multiple pairwise group comparisons, multiple and distinct models, studies using multiple modalities, that mix imaging and non-imaging data, that consider multiple processing pipelines, and even multiple multivariate analyses. All these common cases also need multiple testing correction. We call this multiple testing problem MTP-II, to discern it from the well known multiple testing problem across space, described above, which we term MTP-I.

One of the many combining functions possible with NPC, the one proposed by Tippett (1931), has a further property that makes it remarkably interesting. The Tippett function uses the smallest p-value across partial tests as its test statistic. Alternatively, if all statistics are comparable, it can be formulated in terms of the maximum statistic. It turns out that the distribution of the maximum statistic across a set of tests is also the distribution that can be used in a closed testing procedure (Marcus et al., 1976) to correct for the familywise error rate (FWER) using resampling methods, such as permutation. In the context of joint inference, FWER-correction can also be seen as an UIT. Thus, NPC offers a link between combination of multiple tests, and correction for multiple tests, in both cases regardless of any dependence between such tests.

This means that the MTP-II, for which correction in the parametric realm is either non-existing or fiendishly difficult, can be accommodated easily. It requires no explicit modelling of the dependence between the tests, and the resulting error rates are controlled exactly at the test level, adding rigour to what otherwise could lead to an excess of false positives without correction, or be overly conservative if a naïve correction such as Bonferroni were attempted.

Modifying for imaging applications

As originally proposed, in practice NPC cannot be used in brain imaging. As the statistics for all partial tests for all permutations need to be recorded, an enormous amount of space for data storage is necessary. Even if storage space were not a problem, the discreteness of the p-values for the partial tests is problematic when correcting for multiple testing, because with thousands of tests in an image, ties are likely to occur, further causing ties among the combined statistics. If too many tests across an image share the same most extreme statistic, correction for the MTP-I, while still valid, becomes less powerful (Westfall and Young, 1993; Pantazis et al., 2005). The most obvious workaround — run an ever larger number of permutations to break the ties — may not be possible for small sample sizes, or when possible, requires correspondingly larger data storage.

The solution is loosely based on the direct combination of the test statistics, by converting the test statistics of the partial tests to values that behave as p-values, using the asymptotic distribution of the statistics for the partial tests. We call these as “u-values”, in order to emphasise that they are not meant to be read or interpreted as p-values, but rather as transitional values that allow combinations that otherwise would not be possible.

For spatial statistics, the asymptotic distribution of the combined statistic is used, this time to produce a z-score, which can be subjected to the computation of cluster extent, cluster mass, and/or threshold-free cluster enhancement (TFCE; Smith and Nichols, 2009). A flow chart of the modified algorithm is shown below. Click to see it side-by-side with the original.

More power, fewer assumptions

One of the most remarkable features of NPC is that the synchronised permutations implicitly account for the dependence structure among the partial tests. This means that even combining methods originally derived under the assumption of independence can be used when such independence is untenable. As the p-values are assessed via permutations, distributional restrictions are likewise not necessary, liberating NPC from most assumptions that thwart parametric methods in general. This renders NPC a good alternative to classical multivariate tests, such as MANOVA, MANCOVA, and Hotelling’s T2 tests: each of the response variables can be seen as an univariate partial test in the context of the combination, but without the assumptions that are embodied in these old multivariate tests.

As if all the above were not already sufficient, NPC is also more powerful than such classical multivariate tests. This refers to its finite sample consistency property, that is, even with fixed sample size, as the number of modalities being combined increases, the power of the test also increases. The power of classical multivariate tests, however, increases up to a certain point, then begins to decrease, eventually reaching zero when the number of combining variables match the sample size.

The figure below summarises the analysis of a subset of the subjects of a published FMRI study (Brooks et al, 2005) in which painful stimulation was applied to the face, hand, and foot of 12 subjects. Using permutation tests separately, no results could be identified for any of the three types of stimulation. A simple multivariate test, the Hotelling’s T2 test, even assessed using permutations, did not reveal any effect of stimulation either. The NPC results, however, suggest involvement of large portions of the anterior insula and secondary somatosensory cortex. The Fisher, Stouffer and Mudholkar–George combining functions were particularly successful in recovering a small area of activity in the midbrain and periaqueductal gray area, which would be expected from previous studies on pain, but that could not be located from the original, non-combined data.


Detailed assessment of power, using variable number of modalities, and of modalities containing signal, is shown in the paper.

Combinations or conjunctions?

Combination, as done via NPC, is different than conjunctions (Nichols et al., 2005) in the following: in the combination, one seeks for aggregate significance across partial tests, without the need that any individual study is necessarily significant. In the conjunction, it is necessary that all of them, with no exception, is significant. As indicated above, the NPC forms an union-intersection test (UIT; Roy, 1953), whereas the conjunctions form an intersection-union test (IUT; Berger, 1982). The former can be said to be significant if any (or an aggregate) of the partial tests is significant, whereas the latter is significant if all the partial tests are.

Availability

The NPC, with the modifications for brain imaging, is available in the tool PALM — Permutation Analysis of Linear Models. It runs in either Matlab or Octave, and is free (GPL).

References

Contributed to this post: Tom Nichols.

Confidence intervals for Bernoulli trials

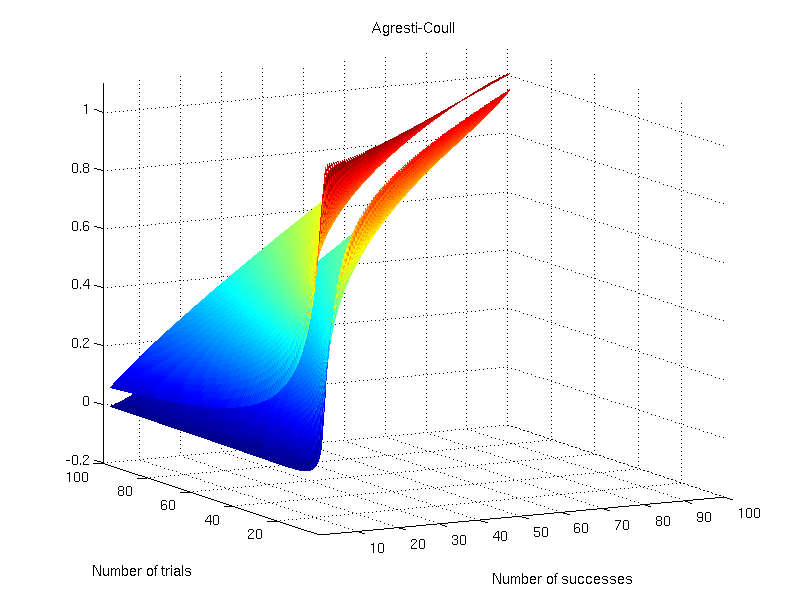
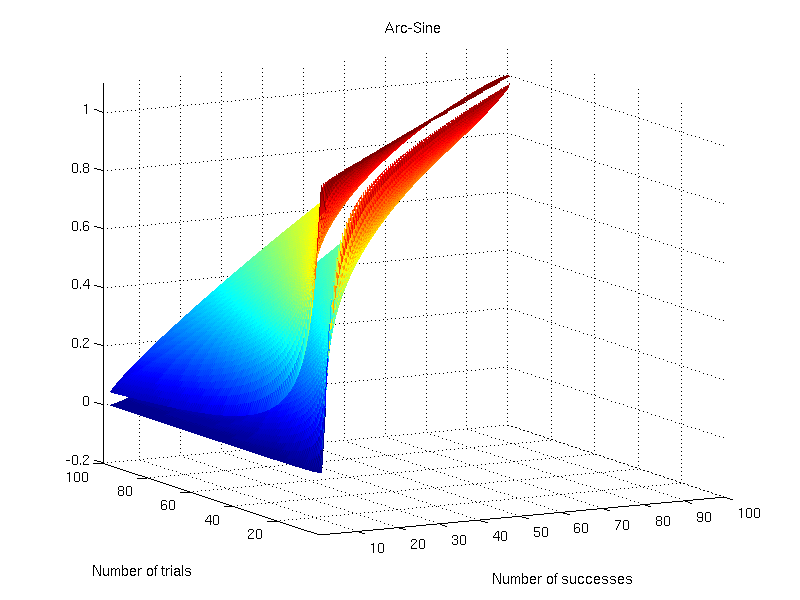
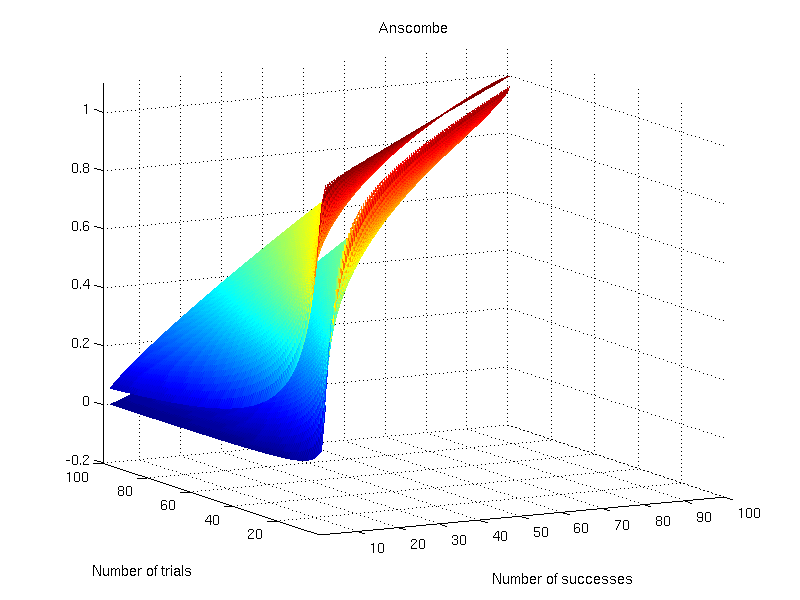
A Bernoulli trial is an experiment in which the outcome can be one of two mutually exclusive results, e.g. true/false, success/failure, heads/tails and so on. A number of methods are available to compute confidence intervals after many such trials have been performed. The most common have been discussed and reviewed by Brown et al. (2001), and are presented below. Consider n trials, with X successes and a significance level of \alpha=0.05 to obtain a 95% confidence interval. For each of the methods, the interval is shown graphically for 1 \leqslant n \leqslant 100 and 1 \leqslant X \leqslant n.

Wald

This is the most common method, discussed in many textbooks, and probably the most problematic for small samples. It is based on a normal approximation to the binomial distribution, and it is often called “Wald interval” for it’s relationship with the Wald test. The interval is calculated as:

  • Lower bound: L=p-k\sqrt{pq/n}
  • Upper bound: U=p+k\sqrt{pq/n}

where k = \Phi^{-1}\{1-\alpha/2\}, \Phi^{-1} is the probit function, p=X/n and q=1-p.

Wald confidence interval.

Wilson

This interval appeared in Wilson (1927) and is defined as:

  • Lower bound: L = \tilde{p} - (k/\tilde{n})\sqrt{npq+k^2/4}
  • Upper bound: U = \tilde{p} + (k/\tilde{n})\sqrt{npq+k^2/4}

where \tilde{p} = \tilde{X}/\tilde{n}, \tilde{n}=n+k^2, \tilde{X} = X+ k^2/2, and the remaining are as above. This is probably the most appropriate for the majority of situations.

Wilson confidence interval.

Agresti-Coull

This interval appeared in Agresti and Coull (1998) and shares many features with the Wilson interval. It is defined as:

  • Lower bound: L = \tilde{p} - k\sqrt{\tilde{p}\tilde{q}/\tilde{n}}
  • Upper bound: U = \tilde{p} + k\sqrt{\tilde{p}\tilde{q}/\tilde{n}}

where \tilde{q}=1-\tilde{p}, and the remaining are as above.

Agresti-Coull confidence interval.

Jeffreys

This interval has a Bayesian motivation and uses the Jeffreys prior (Jeffreys, 1946). It seems to have been introduced by Brown et al. (2001). It is defined as:

  • Lower bound: L = \mathcal{B}^{-1}\{\alpha/2,X+1/2,n-X+1/2\}
  • Upper bound: U = \mathcal{B}^{-1}\{1-\alpha/2,X+1/2,n-X+1/2\}

where \mathcal{B}^{-1}\{x,s_1,s_2\} is the inverse cdf of the beta distribution (not to be confused with the beta function), at the quantile x, and with shape parameters s_1 and s_2.

Jeffreys confidence interval.

Clopper-Pearson

This interval was proposed by Clopper and Pearson (1934) and is based on a binomial test, rather than on approximations, hence sometimes being called “exact”, although it is not “exact” in the common sense. It is considered overly conservative.

  • Lower bound: L = \mathcal{B}^{-1}\{\alpha/2,X,n-X+1\}
  • Upper bound: U = \mathcal{B}^{-1}\{1-\alpha/2,X+1,n-X\}

where \mathcal{B}^{-1}\{x,s_1,s_2\} is the inverse cdf of the beta distribution as above.

Clopper-Pearson confidence interval.

Arc-Sine

This interval is based on the arc-sine variance-stabilising transformation. The interval is defined as:

  • Lower bound: L = \sin\{\arcsin\{\sqrt{a}\} - k/(2\sqrt{n})\}^2
  • Upper bound: U = \sin\{\arcsin\{\sqrt{a}\} + k/(2\sqrt{n})\}^2

where a=\frac{X+3/8}{n+3/4} replaces what otherwise would be p (Anscombe, 1948).

Arc-sine confidence interval.

Logit

This interval is based on the Wald interval for \lambda = \ln\{\frac{X}{n-X}\}. It is defined as:

  • Lower bound: L = e^{\lambda_L}/(1+e^{\lambda_L})
  • Upper bound: U = e^{\lambda_U}/(1+e^{\lambda_U})

where \lambda_L = \lambda - k\sqrt{\hat{V}}, \lambda_U = \lambda + k\sqrt{\hat{V}}, and \hat{V} = \frac{n}{X(n-X)}.

Logit confidence interval.

Anscombe

This interval was proposed by Anscombe (1956) and is based on the logit interval:

  • Lower bound: L = e^{\lambda_L}/(1+e^{\lambda_L})
  • Upper bound: U = e^{\lambda_U}/(1+e^{\lambda_U})

The difference is that \lambda=\ln\{\frac{X+1/2}{n-X+1/2}\} and \hat{V}=\frac{(n+1)(n+2)}{n(X+1)(n-X+1)}. The values for \lambda_L and \lambda_U are as above.

Anscombe’s confidence interval.

Octave/MATLAB implementation

A function that computes these intervals is available here: confint.m.

References

Normality tests I: Brief overview

Before the fast computers era, it was difficult to test how valid certain statistical methods were. Even in the 1970’s and 1980’s, when computers were already available at Universities and even at home, certain matrix operations were limited by hardware constraints. We are now at a much more comfortable position to analyse how these methods perform. One area where (nowadays) simple computer runs can be illuminating is with respect to normality tests. Tests to evaluate normality or a specific distribution, frequentist approaches can be broadly divided into two categories:

  1. Tests based on comparison (“best fit”) with a given distribution, often specified in terms of its cumulative distribution funtion (cdf). Examples are the Kolmogorov-Smirnov test, the Lilliefors test, the Anderson-Darling test, the Cramér-von Mises criterion, as well as the Shapiro-Wilk and Shapiro-Francia tests.
  2. Tests based on descriptive statistics of the sample. Examples are the skewness test, the kurtosis test, the D’Agostino-Pearson omnibus test, the Jarque-Bera test.

In this article I’ll briefly review six well-known normality tests: (1) the test based on skewness, (2) the test based on kurtosis, (3) the D’Agostino-Pearson omnibus test, (4) the Shapiro-Wilk test, (5) the Shapiro-Francia test, and (6) the Jarque-Bera test. In a subsequent article, I’ll analyse the analytical p-value approximations for these tests, and in a third article, I’ll provide Monte Carlo critical values for each of them.

Skewness test

The skewness of the sample data can be converted to an useful score to evaluate normality with the following transformation (D’Agostino, 1970):

  1. Compute the sample skewness \sqrt{b_1} = m_3/m_2^{3/2}, where m_k=\sum_i (X_i-\bar X)^k/n is the k-th moment, \bar X=\sum_i X_i/n is the sample mean, and n is the sample size.
  2. Compute:
    Y = \sqrt{b_1}\left(\frac{(n+1)(n+3)}{6(n+2)}\right)^{1/2}
    \beta_2(\sqrt{b_1}) = \frac{3(n^2+27n-70)(n+1)(n+3)}{(n-2)(n+5)(n+7)(n+9)}
    W^2 = -1+(2(\beta_2(\sqrt{b_1})-1))^{1/2}
    \delta = 1/\sqrt{\ln W}
    \alpha = (2/(W^2-1))^{1/2}
  3. Compute:
    Z(\sqrt{b_1}) = \delta \ln(Y/\alpha + ((Y/\alpha)^2+1)^{1/2})

The Z(\sqrt{b_1}) is the test statistic and it is approximately normally distributed under the null hypothesis that the population data follows a normal distribution.

Kurtosis test

Like the test based on skewness, the test based on kurtosis needs that the sample kurtosis is calculated, then transformed, and finally converted to a p-value. The steps are (Anscombe & Glynn, 1983):

  1. Compute the sample kurtosis b_2=m_4/m_2^2, where m_k=\sum_i (X_i-\bar X)^k/n is the k-th moment, \bar X=\sum_i X_i/n is the sample mean, and n is the sample size.
  2. Compute:
    \mathsf{E}\{b_2\} = 3(n-1)/(n+1)
    \mathsf{var}\{b_2\} = \frac{24n(n-2)(n-3)}{(n+1)^2(n+3)(n+5)}
    x = (b_2-\mathsf{E}\{b_2\})/\sqrt{\mathsf{var}\{b_2\}}
    \sqrt{\beta_1(b_2)}=\frac{6(n^2-5n+2)}{(n+7)(n+9)}\sqrt{\frac{6(n+3)(n+5)}{n(n-2)(n-3)}}
    A = 6+\frac{8}{\sqrt{\beta_1(b_2)}}\left(\frac{2}{\sqrt{\beta_1(b_2)}}+\sqrt{1+\frac{4}{\beta_1(b_2)}}\right), where \mathsf{E}\{\cdot\} and \mathsf{var}\{\cdot\} represent respectively the expected value and the variance.
  3. Compute:
    Z(b_2) = \left(\left(1-\frac{2}{9A}\right)-\left(\frac{1-2/A}{1+x\sqrt{2/(A-4)}}\right)^{1/3}\right)/\sqrt{\frac{2}{9A}}

The Z(b_2) is the test statistic and is considered approximately normally distributed under the null hypothesis that the population data follows a normal distribution.

D’Agostino-Pearson omnibus test

The skewness and kurtosis tests can be combined to produce a single, global, “omnibus” statistic. This global test has been proposed by D’Agostino and Pearson (1973) and its statistic is simply K^2=(Z(\sqrt{b_1}))^2 + (Z(b_2))^2. In other words, simply square the statistics from the skewness and kurtosis tests and sum them together. The distribution of the K^2 statistic is approximately a \chi^2 distribution with two degrees of freedom under the null hypothesis that the sample was drawn from a population with normally distributed values. The skewness, kurtosis and the D’Agostino-Pearson tests have been collectively reviewed and discussed in D’Agostino et al. (1990).

A matlab/Octave implementation of the D’Agostino-Pearson test is available here: daptest.m.

Jarque-Bera test

In a certain regard, this test, introduced by Jarque & Bera (1980) and later discussed in more detail in Jarque & Bera (1987), could also be called an “omnibus” test, that combines skewness and kurtosis into a single statistic. The test statistic is given by \text{\textsc{lm}}= n\left(\frac{(\sqrt{b_1})^2}{6} + \frac{(b_2-3)^2}{24}\right). The \text{\textsc{lm}} is asymptotically distributed as a \chi^2 distribution with two degrees of freedom under the null hypothesis that the sample was drawn from a population with normally distributed values.

A matlab/Octave implementation of the Jarque-Bera test is available here: jbtest.m.

Shapiro-Wilk test

The Shapiro & Wilk (1965) test depends on the covariance matrix between the order statistics of the observations. Values for this covariance matrix have been laboriously tabulated for small samples (Sahan & Greenberg,1956) and algorithms have been developed (Davis & Stephens, 1978; Royston, 1982). In an effort to produce equivalents, yet computationally affordable results, it has been suggested to use approximations. The description here follow the approximation suggested by Royston (1992).

  1. Sort the data in ascending order.
  2. Compute the sample mean \bar X=\sum_i X_i/n, where n is the sample size.
  3. Compute the Blom scores (Blom, 1958) as \tilde m_i = \Phi^{-1}\{(i-3/8)/(n+1/4)\}, where i is the rank order and \Phi^{-1}\{\cdot\} represents the inverse normal cdf.
  4. Compute a set of weights c_i = \tilde m_i \sqrt{(\mathbf{\tilde m}'\mathbf{\tilde m})}. These weights are the same used in the Shapiro-Francia test (see below).
  5. Compute \tilde a_n= - 2.706056u^5 + 4.434685u^4 - 2.071190u^3 - 0.147981u^2 + 0.221157u + c_n, where u=n^{-1/2}. If n>5, compute also \tilde a_{n-1}= -3.582633u^4 + 5.682633u^4 -1.752461u^3 -0.293762u^2 + 0.042981u + c_{n-1}.
  6. Compute \phi = (\mathbf{\tilde m}'\mathbf{\tilde m} - 2\tilde m_n^2)/(1-2\tilde a_n^2) if n \leq 5 or \phi = (\mathbf{\tilde m}'\mathbf{\tilde m} - 2\tilde m_n^2 - 2\tilde m_{n-1}^2)/(1-2\tilde a_n^2-2\tilde a_{n-1}^2) otherwise.
  7. Compute the remaining \tilde a_i = \phi^{-1/2} \tilde m_i for i=2, \ldots ,n-1 if n \leq 5 or i=3,\ldots ,n-2 if n>5.
  8. Compute the test statistic W=\left(\sum_i \tilde a_i X_i \right)^2 / \sum_i (X_i-\bar X)^2.

Once the test statistic W has been produced, it can be approximated through a function g(W) to a normal distribution with mean \mu and standard deviation \sigma (Royston, 1993). For sample sizes between 4 and 11 (inclusive), g(W)=-\ln(\gamma-\ln(1-W)), where \gamma=0.459n-2.273. For sample sizes equal to or larger than 12, g(W)=\ln(1-W).

For 4 \leq n \leq 11, the parameters of the statistic transformed (normalized) by g(W) are given by \mu=-0.0006714n^3 + 0.025054n^2 -0.39978n + 0.5440 and \sigma=\mathsf{exp}\{-0.0020322n^3+ 0.062767n^2 -0.77857n + 1.3822\}. For n \geq 12, \mu = 0.0038915u^3 -0.083751u^2 -0.31082u -1.5851 and \sigma = \mathsf{exp}\{0.0030302u^2 -0.082676u -0.4803\}, where u = \ln(n).

A Z statistic can then be produced trivially by (g(W)-\mu)/\sigma, and the p-values can be obtained from the normal cdf.

A matlab/Octave implementation of the Shapiro-Wilk test is available here: swtest.m.

Shapiro-Francia test

The test was proposed by Shapiro & Francia (1972) as a simplification of the Shapiro-Wilk test. The simplification consisted in replacing the covariance matrix of the order statistics by the identity matrix. The test is generally considered asymptotically equivalent to the Shapiro-Wilk test for large and independent samples. To apply the test, the steps are (Royston, 1993):

  1. Sort the data in ascending order.
  2. Compute the sample mean \bar X=\sum_i X_i/n, where n is the sample size.
  3. Compute the Blom scores (Blom, 1958) as \tilde m_i = \Phi^{-1}\{(i-3/8)/(n+1/4)\}, where i is the rank order and \Phi^{-1}\{\cdot\} represents the inverse normal cumulative distribution function (cdf).
  4. Compute a set of weights c_i = \tilde m_i \sqrt{(\mathbf{\tilde m}'\mathbf{\tilde m})}.
  5. Compute the test statistic W'=\left(\sum_i c_i X_i \right)^2 / \sum_i (X_i-\bar X)^2.

Similarly as for the Shapiro-Wilk test, once the test statistic W' has been produced, it can be approximated through a function g(W')=\ln(1-W') to a normal distribution with mean \mu and standard deviation \sigma (Royston, 1993). The parameters of the statistic transformed (normalized) by g(W') are given by \mu=1.0521u - 1.2725, where u = \ln(\ln(n))-\ln(n) and \sigma=-0.26758v+1.030, where v = \ln(\ln(n))+2/\ln(n). These approximations are valid for samples between 5 and 5000 at least.

A Z statistic can then be produced trivially by (g(W')-\mu)/\sigma, and the p-values can be obtained from the normal cdf.

A matlab/Octave implementation of the Shapiro-Francia test is available here: sftest.m.

References