
Consider a set of 


There are a number of ways to combine these independent, partial tests. The Fisher method is one of these, and is perhaps the most famous and most widely used. The test was presented in Fisher’s now classical book, Statistical Methods for Research Workers, and was described rather succinctly:
When a number of quite independent tests of significance have been made, it sometimes happens that although few or none can be claimed individually as significant, yet the aggregate gives an impression that the probabilities are on the whole lower than would often have been obtained by chance. It is sometimes desired, taking account only of these probabilities, and not of the detailed composition of the data from which they are derived, which may be of very different kinds, to obtain a single test of the significance of the aggregate, based on the product of the probabilities individually observed.
The circumstance that the sum of a number of values ofis itself distributed in the
, the natural logarithm of the probability is equal to
. If therefore we take the natural logarithm of a probability, change its sign and double it, we have the equivalent value of
The test is based on the fact that the probability of rejecting the global null hypothesis is related to intersection of the probabilities of each individual test, 
The logarithm of uniform is exponential
The cumulative distribution function (cdf) of an exponential distribution is:
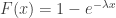
where 

If 
![[0, 1]](https://s0.wp.com/latex.php?latex=%5B0%2C+1%5D&bg=ffffff&fg=333333&s=0&c=20201002)


where 

An exponential with rate 1/2 is chi-squared
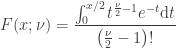
The cdf of a chi-squared distribution with 

If 

In other words, a 
The sum of chi-squared is also chi-squared
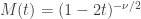
The moment-generating function (mgf) of a sum of independent variables is the product of the mgfs of the respective variables. The mgf of a
The mgf of the sum of 

which also defines a 
Assembling the pieces
With these facts in mind, how to transform the product 


The statistic for the Fisher method is, therefore, computed as:

with 
Reference
The details above are not in the book, presumably omitted by Fisher as the knowledge of these derivation details would be of little practical use. Nonetheless, the reference for the book is:
- Fisher, R. A., 1932. Statistical Methods for Research Workers, 4th Edition. Oliver and Boyd, Edinburgh.
See also
The Fisher’s method to combine p-values is one of the most powerful combining functions that can be used for Non-Parametric Combination.

Excellent explanation!
This is quite confusingly-written – is F(x) a cdf or a random variable?
Thanks for commenting and sorry that the article has confused you. F(x) is a cdf (it’s stated just under the heading “The logarithm of uniform is exponential”).
Pingback: Mission Measurement | The Platinum Standard
Pingback: Bayes Theorem 203: Why Bayes Rules | SINMANTYX
Quick question – is the test a two-sided or one-sided test. In other words how is the p-value calculated?
Hi Rebecca,
The combined statistic follows a Chi^2 distribution of which only the right tail is interesting.
That said, if the p-values for the partial tests (before combination) that are being combined are two-tailed, the combined p-value is automatically represents two-tailed tests. If the p-values before combination are one-tailed, then the combined p-value represents these one-sided tests.
Please, see Figure 3 of our recent paper: http://onlinelibrary.wiley.com/doi/10.1002/hbm.23115/epdf (it’s Open Access)
All the best,
Anderson
Hi Anderson – thanks for the earlier reply. In back again to ask another question since the fisher combined prob test is back on my desk. Could one use a different test to look at these pvalues – say the KS test and test for uniformity (Null: pvalues are uniformly distributed, Alt: pvalues are not uniformly distributed) – would this be an equivalent test or have I messed up the logic. I expect it could give a slightly different answer.
Hi Rebecca,
It is possible to compare distributions (as in the KS test) but that would have a different hypothesis. Instead, one would look directly into the Chi^2 distribution to compute the p-values. In many programming languages the cdf of the Chi^2 is accessible readily (e.g., in Matlab/Octave or R). If not, and if for only a couple of tests, those tables in the final pages of old statistic books also help.
I wouldn’t replace a direct look into the Chi^2 for a test of distributions. If there is a chance that the distribution is not Chi^2 for whatever reason, and if the original data is available, maybe run a permutation test then.
All the best,
Anderson
Thank you for this great post. I recently came across the Fisher method for combining p-values and your post helped explain what exactly this does. However, I am still a bit confused as to the rationale for using this method. From what I can tell, this answers the question: what is the probability of obtaining this particular distribution of p-values (or more extreme) given that there is no effect. However, as you state, this is not a global test of significance, and it leaves out a lot of necessary information on sample and effect sizes- so why do it? Can you help either explain its utility- or point to some resources explaining its utility? Thank you!
Dear David,
Thanks for the comments. The test is in fact a global one, i.e., it seeks evidence for a global effect, that may affect very strongly only a few of the individual tests (called “partial tests”), or may affect modestly many of them.
Perhaps the most interesting part is that the product of p-values isn’t on its own right a p-value, and therefore can’t be used as the p-value for a global test. Instead, this product (or sum of their logs) can be used as the test statistic; once the distribution of this statistic is known, then the p-value for the global test can be obtained, and inference be made.
One would be interested in using the Fisher’s method when there are multiple independent partial tests, each testing a different null hypothesis, or when the null hypotheses are all the same, but the data collected and used for each partial test are different. It is a type of meta-analysis, in which information from multiple studies are collated together in a single result that summarises the evidence available.
Hope this helps.
All the best,
Anderson
Thank you for your clear and helpful explanation.In this method of meta-analysis,could I use FDR p-value for combining p-value or I should use originally p-values?
Hi Elham,
Should use the original p-values. The FDR p-values are not uniformly distributed under the null and therefore, the Fisher’s statistic would no longer follow a Chi^2 distribution.
Hope this helps.
All the best,
Anderson
Hi! I like how this was explained,but could you tell me the date when Fisher’s method was created? I’ve been looking everywhere and cant find it.
Hi,
Thanks for the comments. The method appeared in Ronald Fisher’s 1932 book referenced above. It was probably created just before that. L.H.C. Tippett, who collaborated with Fisher in other projects, had published a related (but different) method in a book in 1931.
Hope this helps.
All the best,
Anderson
Thankyou so much !
Hello, Anderson, thanks for the very clear and interesting post. The method, seems very valuable. I want to be sure that I understand the implications for scientific conclusions. because I have a question for you. Let’s say I have a scientific hypothesis and it makes 4 quite different predictions that I have to test with entirely experimental methods, which I do with say, t-tests, and get a p-value for each one. With Fisher’s Method, I can combine them and get a Chi^2 value, that gives me a much better sense of the likelihood that I am rejecting the (global, which is the intersection of the 4 nulls for the individual tests) null hypothesis correctly (or not) than any one test alone. If this is true, then I wonder why this method is not more widely used in evaluating the strength of conclusions in experimental science? One answer, I guess, is that Fisher’s Method is not even mentioned in any of several of the elementary statistics textbooks for biological science types that I looked at (Zar’s is typical). Do you know of any other reasons why we do not use it more? Of am I missing something?
Thanks a lot.
Hi,
Thanks for the comments. The method is simple and powerful, but it requires independence between the tests that are being combined. In your example, you’d have to have 4 different experiments using completely different datasets to ensure independence. Another problem is that, even in the complete independence case, the combination does not consider the uncertainty of each separate result, that is, it is a “fixed effects” meta-analysis. You may say: well the input p-values are measures of uncertainty. Yes, but these are still treated as fixed in this combination, not as random variables.
Nonetheless, Fisher’s method is very good, and it’s the method we generally recommend for NPC (Non-Parametric Combination).
Hope this helps!
All the best,
Anderson
PS: also, I think Zar doesn’t cover meta-analysis, maybe that’s why Fisher’s combination isn’t mentioned (nor any other).
Ah. Thanks very much! The independence of the tests is not a problem, but I will have to think about (learn about) the fixed effects issue. Thanks again!
Hello again, Anderson. I am just getting back to this question and am still confused about whether it is possible to apply Fisher’s Method to my problem, which is to combine a number of utterly different – different methods, subjects, totally independent – tests of distinct predictions of a single scientific hypothesis and get something like a global significance value for the aggregate result. You note that this would in effect be fixed effects meta analysis model. It seems impossible to see this disparate collection of effects as representing a single population, except in a highly abstract, n-dimensional sort of way. Is that the idea? Or are you saying that, given that Fisher’s Method effectively assumes a fixed effects model, that I can’t apply the Method to my case?
Thanks for any advice or comments.
Hi Bradley,
Thanks for commenting. It’s possible to apply, no doubt. It’s a combination of probabilities and, provided that all original (non-combined) p-values are uniformly distributed under the null, and independent, the method will work. The global (combined) null is that all partial (non-combined) nulls are true; the alternative is that any partial null is false.
The interpretation, of course, depends on what the data represent. I say it’s fixed-effects because no information about the variability between studies or even the variability within study is known by the formula, hence it surely can’t be a random-effects meta-analysis. That said, because effect sizes aren’t known either (all we know is that they scale roughly linearly with log(p_i), each with its own slope), then in a way perhaps it is not even a fixed-effects meta-analysis, which would put it in a category on its own.
If you have a collection of disparate tests, and want to test the null that there are no effects in any of them, then the test is suitable. There is no limitation in that the tests need be all similar in ways (e.g., all testing the exact same phenomenon, varying just the observations used). The only difficulty with heterogeneity is the interpretation back to the real world.
Thanks again!
All the best,
Anderson
Hi Anderson,
Thank you so much for your post. I am new for this field, so I have a question when it comes to
with X following a \chi^{2}_{2k} distribution, from which a p-value for the global hypothesis can be easily obtained.
What does a p-values can be easily obtained mean? Does that mean it is easy to calculate the P(T>=\tau) as it follows a \chi^{2}_{2k} distribution?
Sorry for my stupid question!
All the best,
Jun
Hi Jun,
Correct, that’s exactly it!
All the best,
Anderson
Thank you so much!!
Pingback: Fisher’s combined test vs testing uniform distribution of p-values – GrindSkills