
FreeSurfer offers excellent visualisation capabilities with tksurfer and FreeView. However, there are endless other possibilities using various different computer graphics software. In previous posts, it was shown here in the blog how to generate cortical and subcortical surfaces that could be imported into these applications, as well as how to generate models with vertexwise and facewise colours, and even a description of common file formats. It was also previously shown how to arbitrarily change the colours of regions for use with FreeSurfer own tools. However, a method to allow rendering cortical regions with different colours in software such as Blender was missing. This is what this post is about.
The idea is simple: splitting the cortical surface into one mesh per parcellation allows each to be imported as an independent object, and so, it becomes straightforward to apply a different colour for each one. To split, the first step is to convert the FreeSurfer annotation file to a data-per-vertex file (*.dpv). This can be done with the command annot2dpv.
./annot2dpv lh.aparc.annot lh.aparc.annot.dpv
Before running, be sure that ${FREESURFER_HOME}/matlab is in the Octave/matlab, path. With the data-per-vertex file ready, do the splitting of the surface with splitsrf:
./splitsrf lh.white lh.aparc.annot.dpv lh.white_roi
This will create several files names as lh.white_roi*. Each corresponds to one piece of the cortex, in *.srf format. To convert to a format that can be read directly into computer graphics software, see the instructions here.
The annot2dpv and splitsrf are now included in the package for areal analysis, available here.
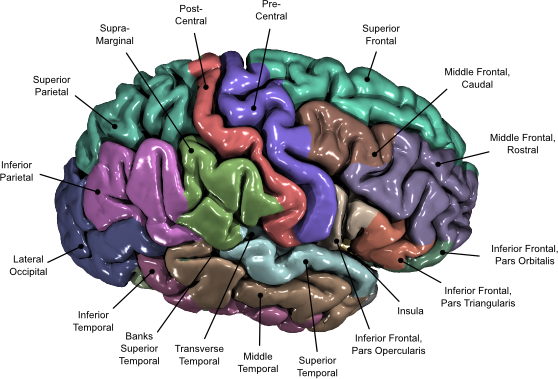
With the meshes imported, let your imagination and creativity fly. Once produced, labels can be added to the renderings using software such as Inkscape, to produce images as the one above, of the Desikan-Killiany atlas, which illustrates the paper Cortical Thickness or Gray Matter Volume: The Importance of Selecting the Phenotype for Imaging Genetics Studies.
Another method is also possible, without the need to split the cortex, but instead, painting the voxels. This can be done with the command replacedpx, also available from the package above. In this case each region index is replaced by its corresponding statistical value (or any other value), then maps are produced with the dpx2map, shown in an earlier blog post, here. This other method, however, requires that the label indices are known for each region, which in FreeSurfer depends on the rgb colors assigned to them. Moreover, the resulting maps don’t have as sharp and beautiful borders as when the surface is split into independent pieces.
