
The OASIS dataset consists of a number of T1-weighted mri brain scans, which has been kindly offered online at http://www.oasis-brains.org. The dataset can be downloaded for free after accepting an academic agreement available at the website. The data was released in analyze 7.5 file format. This format, despite having been used by the neuroimaging community for many years, suffers from not including orientation information. The nifti format addresses this concern, but when converting, some care has to be taken to ensure that there are no left-right flips. Fortunately, for this dataset, during acquisition a capsule of vitamin E was placed next to the head of each subject, on the left side, which is very helpful to identify the correct side (Marcus et al., 2007).
There are still problems, though. The nifti format has not been fully implemented in all common software packages and worse, some packages interpret differently the information contained in the header. Images that look fine in fsl‘s FSLview or FreeSurfer‘s Freeview may look stretched or shrunken in spm for instance. And images that look fine in both, may still be oriented incorrectly in Mango. Although a bit cumbersome, the procedure below ensures that the oasis images can be converted from analyze to nifti in a way that it can correctly read and shown by Mango, fsl, FreeSurfer and spm. The procedure uses exclusively fsl tools:
- Convert to nifti:
fslchfiletype NIFTI_GZ OAS1_0001_MR1_mpr-1_anon.hdr - Make sure there is no undesired orientation information:
fslorient -deleteorient OAS1_0001_MR1_mpr-1_anon.nii.gz - Set the sform_code as 2, which is for “aligned anatomy”. Although this is still in native, not aligned space, it ensures that software will read them appropriately:
fslorient -setsformcode 2 OAS1_0001_MR1_mpr-1_anon.nii.gz - Set the sform as the following matrix:
fslorient -setsform 0 0 -1.25 0 1 0 0 0 0 1 0 0 0 0 0 1 OAS1_0001_MR1_mpr-1_anon.nii.gz - Swap the order of the data. Again, this isn’t really necessary, except to ensure that different applications will all read correctly:
fslswapdim OAS1_0001_MR1_mpr-1_anon.nii.gz RL PA IS OAS1_0001_MR1_mpr-1_anon.nii.gz - fsl tries to preserve orientation and, when the voxels are reordered, it modifies the header accordingly, resulting in no net transformation when seen with fsl tools. To resolve this, it’s necessary to change the header again, now the qform:
fslorient -setqform -1.25 0 0 0 0 1 0 0 0 0 1 0 0 0 0 1 OAS1_0001_MR1_mpr-1_anon.nii.gz
These steps can be placed inside a simple loop within the shell for either Linux and Mac, like below (click here to download):
#!/bin/bash

# Directory where the OASIS data is located
ROOTDIR=/Volumes/HD2/oasis-dataset-416subj/original

# Directory to save results
NIFTIDIR=${ROOTDIR}/../nifti

# Go to the directory with the data
cd ${ROOTDIR}

# For each subject
for s in * ; do

  # Some feedback in the screen
  echo ${s}

  # Create directory to save the results, if not existing
  mkdir -p ${NIFTIDIR}/${s}

  # Directory of the original, raw data
  cd ${ROOTDIR}/${s}/RAW

  # For each acquisition
  for a in *.hdr ; do

    # Do each of the 6 steps described in the blog
    ${FSLDIR}/bin/fslchfiletype NIFTI_GZ ${a} ${NIFTIDIR}/${s}/${a%.hdr}
    ${FSLDIR}/bin/fslorient -deleteorient ${NIFTIDIR}/${s}/${a%.hdr}
    ${FSLDIR}/bin/fslorient -setsformcode 2 ${NIFTIDIR}/${s}/${a%.hdr}
    ${FSLDIR}/bin/fslorient -setsform  0 0 -1.25 0  1 0 0 0  0 1 0 0  0 0 0 1  ${NIFTIDIR}/${s}/${a%.hdr}
    ${FSLDIR}/bin/fslswapdim ${NIFTIDIR}/${s}/${a%.hdr} RL PA IS ${NIFTIDIR}/${s}/${a%.hdr}
    ${FSLDIR}/bin/fslorient -setqform -1.25 0 0 0  0 1 0 0  0 0 1 0  0 0 0 1  ${NIFTIDIR}/${s}/${a%.hdr}
  done
done

echo "Done!"
The reference for the oasis dataset is:
- Marcus DS, Wang TH, Parker J, Csernansky JG, Morris JC, Buckner RL. Open Access Series of Imaging Studies (OASIS): cross-sectional MRI data in young, middle aged, nondemented, and demented older adults. Journal of Cognitive Neuroscience. 2007;19(9):1498-507.


 , where
  is the k-th moment,
  is the sample mean, and
  is the sample size.
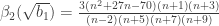


 is the test statistic and it is approximately normally distributed under the null hypothesis that the population data follows a normal distribution.
 , where


 , where
  and
and  represent respectively the expected value and the variance.
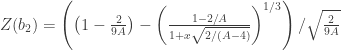
 is the test statistic and is considered approximately normally distributed under the null hypothesis that the population data follows a normal distribution.
 . In other words, simply square the statistics from the skewness and kurtosis tests and sum them together. The distribution of the
  statistic is approximately a
  distribution with two degrees of freedom under the null hypothesis that the sample was drawn from a population with normally distributed values. The skewness, kurtosis and the D’Agostino-Pearson tests have been collectively reviewed and discussed in
  . The
. The  is asymptotically distributed as a
  , where
  is the rank order and
  represents the inverse normal cdf.
 . These weights are the same used in the Shapiro-Francia test (see below).
 , where
  . If
. If  , compute also
  .
. if
if  or
or  otherwise.
 for
for  if
if  if
if  .
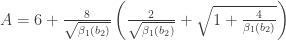
. has been produced, it can be approximated through a function
  to a normal distribution with mean
  and standard deviation
  (
( , where
 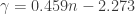 . For sample sizes equal to or larger than 12,
  .
. , the parameters of the statistic transformed (normalized) by
  and
and  . For
. For  ,
,  and
and  , where
  .
. statistic can then be produced trivially by
  , and the p-values can be obtained from the normal cdf.
 .
. has been produced, it can be approximated through a function
  to a normal distribution with mean
  are given by
  , where
 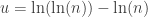 and
and  , where
  . These approximations are valid for samples between 5 and 5000 at least.
 , and the p-values can be obtained from the normal cdf.