
Until mid-1990’s, control of the error rate under multiple testing was done, in general, using family-wise error rate (FWER). An example of this kind of correction is the Bonferroni correction. In an influential paper, Benjamini and Hochberg (1995) introduced the concept of false discovery rate (FDR) as a way to allow inference when many tests are being conducted. Differently than FWER, which controls the probability of committing a type I error for any of a family of tests, FDR allows the researcher to tolerate a certain number of tests to be incorrectly discovered. The word rate in the FDR is in fact a misnomer, as the FDR is the proportion of discoveries that are false among all discoveries, i.e., proportion of incorrect rejections among all rejections of the null hypothesis.
Benjamini and Hochberg’s FDR-controlling procedure
Consider testing 


FDR correction
The procedure described above effectively defines a single number, a threshold, that can be used to declare tests as significant or not at the level 
FDR adjustment
The problem with the FDR-correction is that 
To address this concern, Yekutieli and Benjamini (1999) introduced the FDR-adjustment, in which monotonicity is enforced, and which definition is compatible with the original FDR definition. Let 


Example
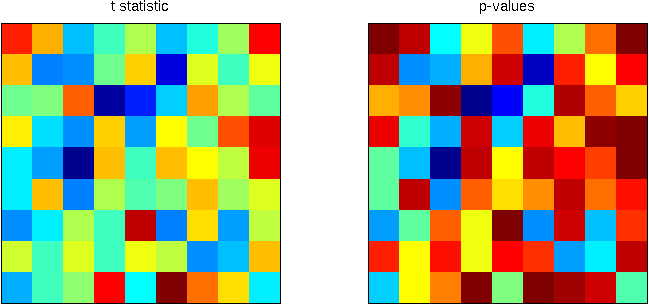
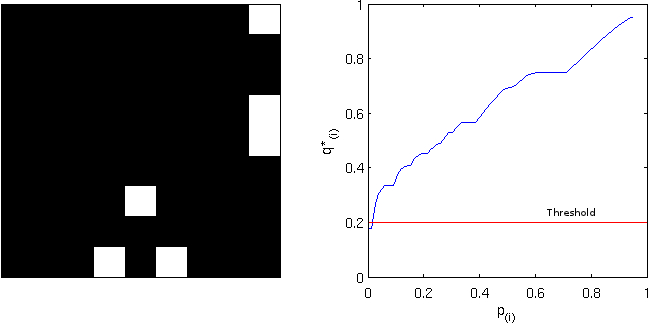
Consider the image below, on the left, a square of 9×9 pixels containing each some t-statistic with some sparse, low magnitude signal added. On the right are the corresponding p-values, ranging approximately between 0-1:
Statistical maps
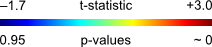
Using the B&H procedure to compute the threshold, with 
FDR-threshold
Computing the FDR-corrected values at each pixel, and thresholding at the same
FDR-corrected
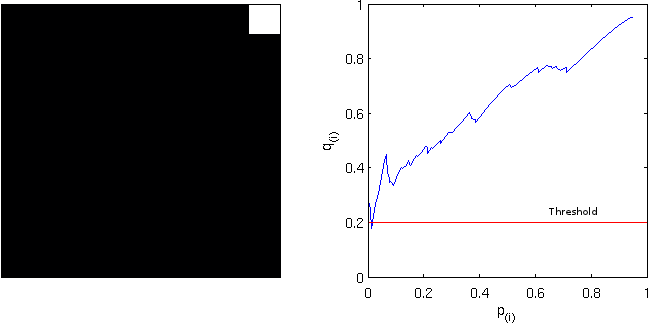
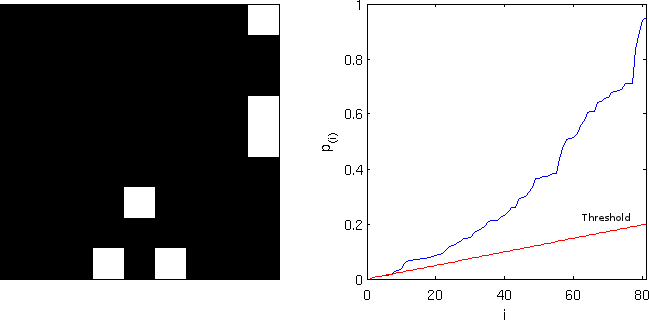
Computing instead the FDR-adjusted values, and thresholding again at
FDR-adjusted
Implementation
An implementation of the three styles of FDR for Octave/MATLAB is available here: fdr.m
SPM users will find a similar feature in the function spm_P_FDR.m.
References
- Benjamini Y and Hochberg Y. Controlling the False Discovery Rate: A Practical and Powerful Approach to Multiple Testing. J R Statist Soc B. 1995; 57(1):289-300.
- Yekutieli D and Benjamini Y. Resampling-based false discovery rate controlling multiple test procedures for correlated test statistics. J Stat Plan Infer. 1999; 82(1-2):171-96.
- Benjamini Y and Yekutieli D. The control of the false discovery rate in multiple testing under dependency. Ann Statist. 2001; 29(4):1165-88.
- Genovese CR, Lazar NA, Nichols T. Thresholding of statistical maps in functional neuroimaging using the false discovery rate. Neuroimage. 2002 Apr;15(4):870-8.

Hi,
I am doing genome wide association study . After analysis I am getting p-values and FDR adjusted p-values. Could you please tell me about SNPs most significant….. I am pasting some of the results…
SNP P.value FDR_Adjusted_P-values
SNP13114 3.56E-09 1.52E-05
SNP4683 6. 58E-09 1.88E-05
SNP13114 8.80E-09 1.88E-05
SNP13061 1.23E-08 1.71E-05
SNP12690 7.58E-05 0.113065
SNP9766 7.81E-05 0.113065
SNP9769 7.81E-05 0.113065
SNP2215 0.000472 0.511954
SNP3436 0.001216 0.877387
SNP3221 0.001532 0.877387
SNP5367 1.74E-05 0.999769
SNP5010 1.92E-05 0.999769
SNP10332 3.29E-05 0.999769
Is the mean of this table the last SNPs are not significantly associated with traits or my interpretation is wrong.
Thanks,
Are these all the p-values you found, or only some (e.g., only the lowest 13)? If these are all, then all are significant at q<=0.05. The threshold is 0.0015320. However, the adjusted p-values I get are different than yours, see below (in the same order).
3.8133e-08
3.8133e-08
3.8133e-08
3.9975e-08
1.0153e-04
1.0153e-04
1.0153e-04
5.5782e-04
1.3173e-03
1.5320e-03
4.1600e-05
4.1600e-05
6.1100e-05
PS: Oh, these are only some of the p-vals, as this is from a GWA study. If you got the p-adjusted using the ‘fdr.m’ function, they should be correct and you can say confidently that all the adjusted values below 0.05 (or any other q-level you prefer) are significant. Hope this helps!
No, these are not all p-values, I’ve chose them from whole set to clear my question. Suppose I am getting p-value=3.56E-09 and its FDR adjusted p-value=1.52E-05 while in second case p-value=3.29E-05 and its adjusted p-value=0.999769? what the mean of both values, is first significant and second significant for p-value but due to high FDR value its non-significant or there is something other meaning?
These are GWAS data from a diploid plant species for genome wide SNPs.
Suggest what to do?
Thanks for your replies.
Vinod Kumar
Hi Vinod,
The adjusted values that are below q=0.05 (or another q-level you may choose) can be declared as significant. The same would be obtained if, instead of the p-adjustment, the FDR threshold had been calculated, in which case the p-values below the threshold would be declared as significant. So, in the example you gave, for a q=0.05, the first can be considered significant, but not the second. In the initial list of p-values you posted, the first four p-values are significant at q=0.05, but not the remaining ones.
Hope this helps!
All the best,
Anderson
HI Anderson,
Thanks for making the point clear to me. If I follow this one then in my GWAS using 6000 SNPs, only 10-15 SNPs are significant for only two traits while I’ve used 28 traits for my analysis. I am confused what to do with this? Is there any method which assure me that FDR-Adjusted p-values are correct and my all SNPs are null.
Thanks,
Vinod
Hi Vinod,
Sounds you don’t have strong results… The method for adjustment is the same described in Yekutieli & Benjamini (1999) and should be correct. The FDR (either the B&H threshold or the Y&B adjustment) has the property that, if there are no true effects, it controls the FWE (i.e., the family-wise error rate). This may explain why in about 2 out of the 28 traits (~7%) significant results were found. However this doesn’t prove the null, only fails to reject it, as do most other methods…
All the best!
Anderson
Hi,
I have some confusion regrading results of GWAS conducted for a diploid plant species for Na content measured under control and under salt imposed condition. I got 32 highly significant (FDR corrected) SNPs only under control condition while I am not getting any of the significant SNP under salt imposed condition. Is it mean that my study is not fruitful or still I can say something about.
Can you researchers here, help me in this regard.
Thanks
Vinod
Hi Vinod,
Your question sounds more a biology/GWAS-specific than FDR-related. If you did all correctly, then in principle, yes, you can say that there is no effect. But there may be other aspects to your study that may need to be checked before giving up entirely, with no bearing with multiple testing.
All the best,
Anderson
Hi,
I have a question regarding GWAS. Suppose, If I am getting 5 FDR corrected SNPs in MLM analysis while the same SNPs are not significant in GLM analysis and have higher p-values. What is mean by this? Do familial relationship is doing something here or what should I deduce from these results?
Thanks,
Vinod
Hi Vinod,
GLM should be avoided with pedigree data, and this has no bearing with FDR.
All the best,
Anderson
Pingback: Unrelated to all that, 2/21 edition | neuroecology
Hi,
How can we calculate FDR threshold? Is there any program we can calculate ? I am using Nexus Copy Numbers Program.
Thanks for your replies.
Hi Tuğçe,
Please, see in the main article the “fdr.m” file. It’s a function that can be used in either Matlab or Octave, and which will give the threshold and also corrected and adjusted p-values. I’m not familiar with Nexus so I can’t help on this one.
All the best,
Anderson
Is there a mistake in the equation for FDR correction?
It should be:
q(i) = (p(i)*N)/i
and not
q(i) = pow(p(i),N)/i
or am I getting something wrong?
Hi Nic,
The formula in the article is correct, i.e., there is no power involved. The “(i)” is a subscript, and the p-values are multiplied by N, not raised to N.
It might perhaps give this impression because of the small formatting in WordPress (the blog engine), but if you hover the mouse on the equation, it shows in the original LaTeX typing, which should disambiguate this.
All the best,
Anderson
I am looking for an FDR analysis that takes account of the number of values that pass the uncorrected p criterion even if none pass the B & H (1995) criterion. Suppose I have a correlation table with 100 tests of which 20 have p values < 0.05, though none are < 0.01. By chance, we would expect only 5 to pass the < 0.05 criterion, so the implication is that 15 of the correlations are actually significant, although we don't know which ones.
I am looking for support for two (novel) approaches that I am not finding in the literature. One is to say that there is a 75% probability (15/20) that each of these correlations are significant at p < 0.05. The other is to suggest that the 15 with the lowest p values are the ones most likely to actually be significant. I have not found any discussion of either of these option in the FDR literature and would appreciate an informed opinion about it.
Hi Christopher,
I believe something along these lines may been done before. Please see: Wilkinson B. A statistical consideration in psychological research. Psychol Bull. 1951 May;48(3):156-8.
The paper proposes computing a p-value for the probability of observing a certain number of significant findings when there are multiple tests using a binomial expansion.
Specifically about the two approaches you mention, and in the context of FDR, I haven’t heard anything about.
All the best,
Anderson
Hi
In your great explanation you say:
Let q*… be the FDR-adjusted value … where q is the FDR-corrected
But in your code…
padj(i) = min(prev,pval(i)*V*cV/i);
when you should use pcor, not pval
Greetings
Hi Howard,
Thanks for commenting. The code is fine: pcor(i) = pval(i)*V*cV/i.
Having said that, perhaps the code could be simplified, such that that line would read instead:
padj(i) = min(prev,pcor(i));
since pcor is already produced a few lines above, and thus pcor(i) wouldn’t need to be computed again at the i-th iteration. Regardless, this would only make the code just a tiny bit faster, but wouldn’t change the results.
Thanks again for the feedback!
All the best,
Anderson
Thanks so much for this. It has demystified a few things.
Which version is implemented in FSL? Both in PALM’s FDR correction and the standalone fdr program?
Hi Tobias,
Thanks for the comments. In FSL, the option “-a” in the command “fdr” gives the adjusted results. In PALM, the option “-fdr” also gives adjusted. Hope this helps!
All the best,
Anderson
It is not clear whether the default of cV =1 is the adjusted or corrected method. Can you please clarify? Thanks.
Sorry, I now see you can get both adjusted and corrected values with pcor and padj. I was wondering what the difference between the harmonic sum for c(V) (cV =0) is versus the default (cV =1).
Hi,
The c(V)=1 is sufficient for nearly all cases. The c(V) = Mascheroni constant has been proven to yield nominal error rates under some unusual scenarios. For general purpose, c(V)=1 is fine.
All the best,
Anderson
Hi,
It applies to both cases.
All the best,
Anderson
Hi Anderson, thanks for the great article, very informative.
I’m struggling to understand q-value within the context of a paper I’m currently reading, which for a certain hypothesis states “it is not statistically significant after correcting for multiple hypothesis testing (q value = 0.260).” Don’t we need to know to what FDR they’re comparing this q-value to know if it’s statistically significant or not? The authors do not report an FDR baseline anywhere in their paper. If they were using an FDR of 0.30, for example, then we could reject the null with a q-value of 0.260.
Another question: what baseline FDR (q) is typically used? I assume this is different than the typical statistical convention of using 0.05 for p-values.
Thank you!
Hi Alex,
Thanks for the comments. It seems to me that the authors want to say that their result will only be significant if about 1/4 of all discoveries are false, which is quite a lenient level.
The most common level used for FDR is 0.05, but it didn’t have to be, and other values, lower or higher, can be considered.
All the best,
Anderson
Hello,
Firstly, thank you for the helpful post. I’m using your fdr method in matlab and I found that with a vector of p-values, most of which are less than 0.05, I am getting an output of 0 as my fdr-based p threshold. I’m not understanding how this makes sense. Could you explain? I uploaded an image so you can see what the vector looks like: https://ibb.co/jxJ4Pw
Thanks!
Dear Robert,
That means that, despite the fact that all values are small, none is below the FDR cutoff once ordered. I can’t copy/paste from the screenshot, but if you could make the p-values accessible somewhere online in text format, I can double check. The results isn’t surprising, though; it can well happen.
All the best,
Anderson
Anderson, thank you for builiding this function. I have used it in an analysis and would like to acknowledge your function in the manuscript. How do you suggest I do that?
Hi KES,
Thanks for the feedback. There’s no need to acknowledge really. But if you think the readers should know where the function came from, perhaps you could indicate that with something as “We used the fdr.m function available at https://brainder.org/2011/09/05/fdr-corrected-fdr-adjusted-p-values/“.
All the best,
Anderson
Hi Anderson,
I am confused what are the differences between Corrected & Adjusted P-values and combining p-values? At first, I thought I understand what does combining p-values mean, but after learning the adjusted p-values my brain cannot work… :(
Is the combining p-values for the rejection of global null hypothesis while Corrected & Adjusted P-values is for controlling the false rate? I have no idea what I am talking about, would you mind helping me explain a little big?
Thanks in advance!!
All the best,
Jun
Hi Jun,
There are a number of similarities between the combination and the correction (particularly FWER correction, not so much FDR), but perhaps it’s better, for ease of grasping these concepts, to think them as if entirely different. I won’t have much time to explain but there are many online resources discussing this. In short: the combination seeks to use separate tests jointly, for a single inference, whereas the correction seeks to avoid excess of false positives that happen if many tests are conducted separately.
All the best,
Anderson
Hi Anderson,
Thank you so much!
I think I had a rough understanding now.
Best wishes,
Jun
Hi Anderson,
Thanks very much for your helpful article. I have a very basic question about the input for FDR. For the p-value vector, should this be all of the significant/marginal p-values from the analysis set? Or all p-values from the analyses, significant or not. I’ve had conflicting suggestions on this. (When I ran it the latter way, all my q-values came out as 1, compared with q-values of 0.2 for the significant-only set). Any advice you can offer is greatly appreciated.
All the best,
Kelley
Hi Kelley,
You’d use all the p-values, not just the significant ones from some previous thresholding.
It’s important to include all p-values. If the FDR is supplied with lots of small p-values, it ‘thinks’ that there is a lot of true signal, then it allows for more false positives, so as to keep the proportion. The way to prevent this (and the correct way of using it) is by entering all p-values from the analysis.
All the best,
Anderson
Thank you so much, Anderson. This is very helpful info, and your explanation makes the reasons clear. I really appreciate your help.
All the best,
Kelley